Layer-by-Layer Recognition
Once the image has been effectively layered, we can further design corresponding models based on our previous assumptions to identify text regions in the image through layer-by-layer processing.
Connectivity
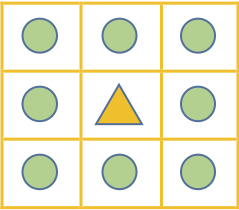
As can be seen, each layer of the image consists of several connected components. Since text itself is composed of relatively dense strokes, it often forms a connected component. Connectivity here is defined as 8-connectivity, meaning the 8 pixels surrounding a given pixel are defined as adjacent. Adjacent pixels are then defined as belonging to the same connected component.
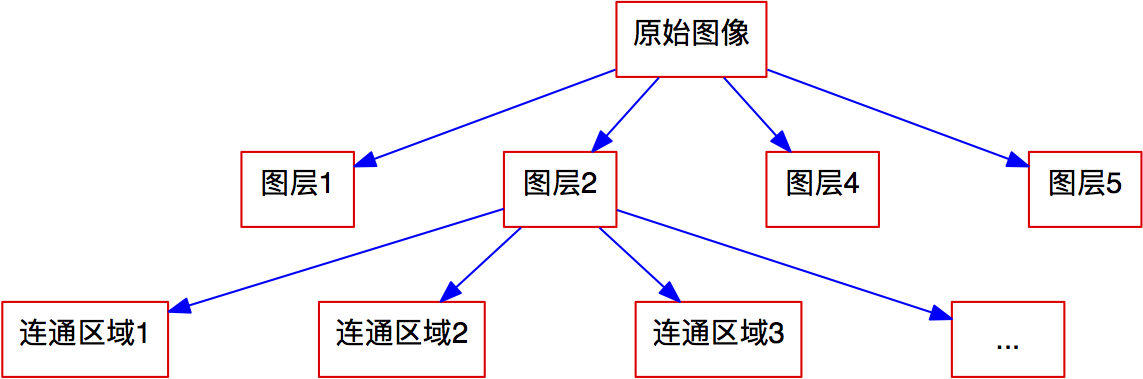
With the definition of connected components, each layer is segmented into several connected regions. In other words, we gradually decompose the original image, as shown in Figure 9.
Erosion Resistance
After decomposing the image to the granularity of connected components, we stop further subdivision and begin identifying which regions are likely to be text regions. Here, we require text to have a certain degree of erosion resistance. Therefore, we first define erosion.
Erosion is a morphological transformation in image processing, generally applied to binary images. For non-zero pixels (pixels with a value of 1) in a binary image, if all its adjacent pixels are also 1, it remains unchanged; otherwise, it becomes 0. Here, we also use the 8-connectivity definition. It can be observed that the longer the boundary of a connected component, the greater the "damage" caused by the erosion operation. Conversely, the shorter the boundary, the smaller the "damage."
Based on the definition of erosion above, we can establish a requirement for text regions:
Erosion Resistance Requirement: The connected component where the text is located should possess a certain degree of erosion resistance.
The term "certain" refers to a continuous range—it cannot be too large or too small. For example, a large square area has very strong erosion resistance because its boundary is short relative to its area, but such areas are clearly not text regions (the rice cooker in Layer 5 from the previous article belongs to this type). On the other hand, if the erosion resistance is too weak, such as with thin lines, they might disappear after erosion; these are also not considered candidate text regions (the text boundaries in Layer 4 from the previous article belong to this type).
We can define an indicator for erosion resistance: \text{Erosion Resistance of a Connected Component} = \frac{\text{Total area after erosion}}{\text{Total area before erosion}} \tag{7} Through testing, the erosion resistance of text regions generally falls within the range of [0.1, 0.9].
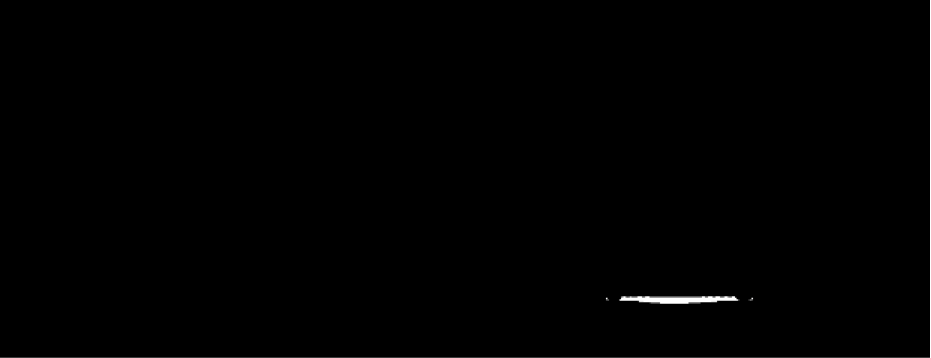
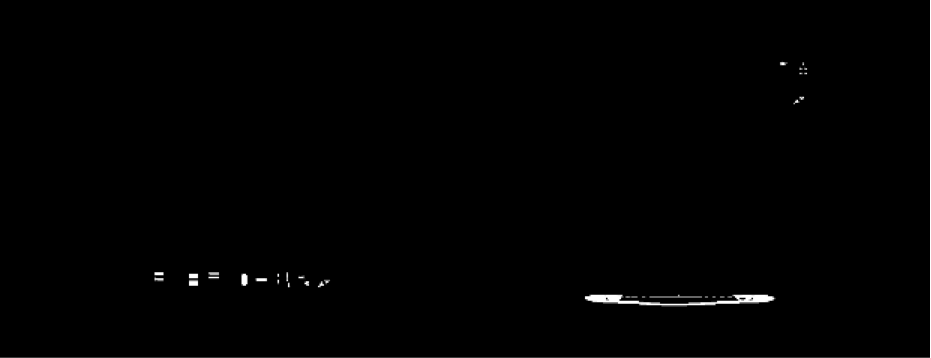
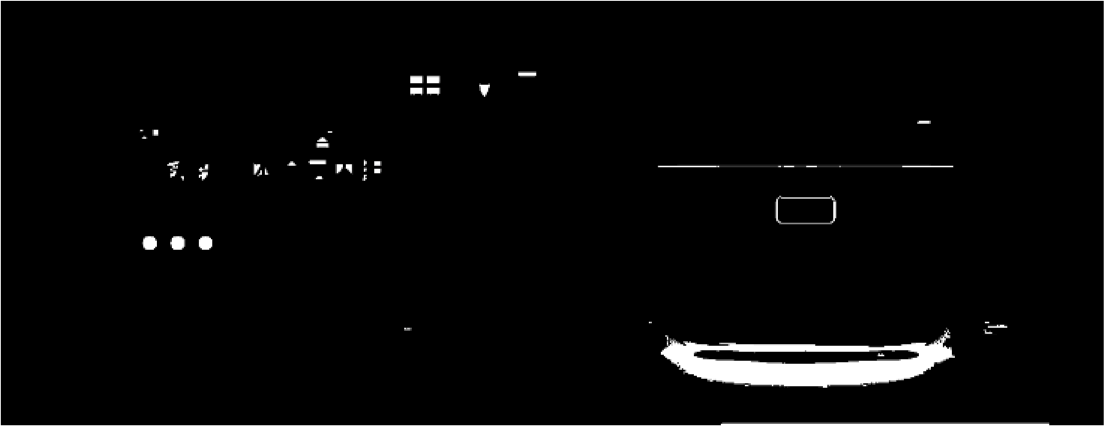
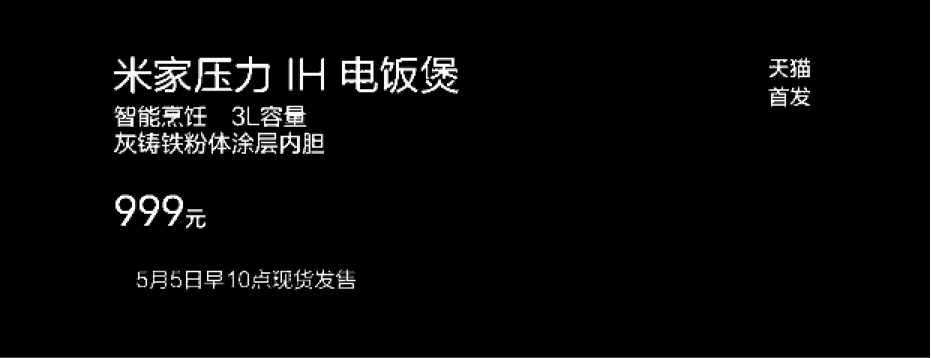
After filtering the five decomposed layers based on erosion resistance, we obtain the following feature layers:

Pooling Operation
So far, we have obtained five feature layers. Although it is visible to the naked eye that the text is mainly concentrated in the fifth feature layer, for general images, text may be distributed across multiple feature layers. Therefore, the feature layers need to be integrated. Our method for feature integration is similar to "pooling" in Convolutional Neural Networks, so we have borrowed this term.
First, we superimpose the five feature layers to obtain a global image feature (referred to as the superimposed feature). While this superimposed feature could be used as the final output, it is not the best method. We believe that the main text features within a certain region should be concentrated in a specific feature layer rather than scattered across all of them. Therefore, after obtaining the superimposed feature, we use a method similar to "Max Pooling" to integrate the features. The steps are as follows:
Directly superimpose the features, then partition the superimposed features into connected components.
Detect which feature layer provides the primary contribution to each connected component; the connected component then only retains the source from that specific feature layer.
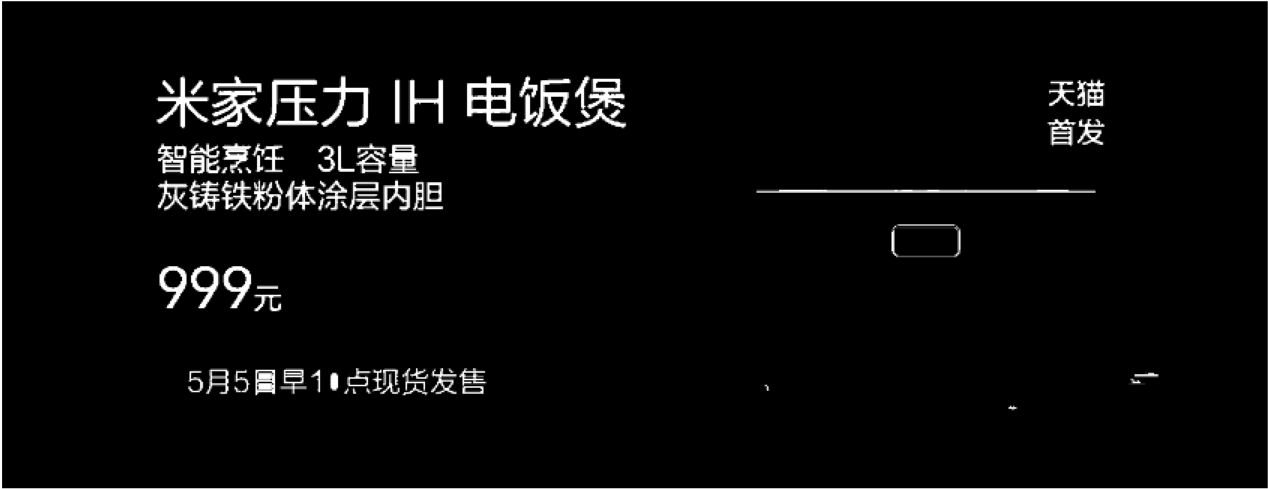
After this pooling operation, the final feature result is shown in Figure 11.
Post-processing
For the image used in our demonstration, the feature map in Figure 11 obtained after the above operations requires no further processing. However, for general images, some poorly processed regions may still exist, requiring further exclusion based on the previous results. The exclusion process mainly consists of two steps: low/high-density area exclusion and isolated area exclusion.
Density Exclusion
One type of connected component that is clearly not a text region is a low-density area. A typical example is a connected component formed by table lines; such areas cover a large range but contain very few points, meaning the density is very low. These low-density areas can be excluded. First, let us define the density of a connected component and a low-density area:
Connected Component Density: Starting from a connected component, find its horizontal bounding box. The density of the region is defined as: \text{Density} = \frac{\text{Area of Connected Component}}{\text{Area of Bounding Box}} \times \frac{\text{Total Area of Original Image}}{\text{Area of Bounding Box}} \tag{8}
Low-Density Area: If the density of a connected component is less than 16, the connected component is defined as a low-density area.
Intuitively, the definition should be the ratio of the component area to the bounding box area, but an additional factor (Total Area / Bounding Box Area) is included here to incorporate the influence of the area size. Since text generally has clear boundaries and is easily segmented, larger areas are generally less likely to be text regions. The parameter 16 is an empirical value.
Low-density area exclusion is an effective method for removing non-text regions with many lines, such as tables. Similarly, large high-density areas also need to be excluded. Once low-density areas are defined, it is easy to define high-density areas:
High-Density Area Definition (Initial): If the region formed by inverting the horizontal bounding box of a connected component is a low-density area, then that connected component is defined as a high-density area.
This definition is natural but has certain irrationalities. For example, the Chinese character "one" is a horizontal rectangle; thus, the density after inversion would be 0, and the character "one" would be excluded, which is incorrect. A solution to this problem is:
High-Density Area Definition (Revised): A connected component is defined as a high-density area if and only if the following condition is met: \frac{1 + \text{Area of Bounding Box} - \text{Area of Connected Component}}{\text{Area of Bounding Box}} \times \frac{\text{Total Area of Original Image}}{\text{Area of Bounding Box}} < 16 \tag{9}
This adds 1 to the original definition to prevent the density from becoming 0 after inversion.
There is another case of failure: if the input image is a single-character image, there is only one connected component, and the ratio of the total image area to the bounding box area is close to 1. Consequently, it may be judged as a low-density area, thus excluding the single character. This situation is indeed difficult to balance. A feasible solution is to manually specify whether the mode is single-character, single-line, or full-image; Google’s Tesseract OCR also provides such options.
Isolated Area Exclusion
The premise of isolated area exclusion is that text and strokes should be relatively compact. If a region is clearly isolated from other regions, it is likely not a text region. In other words, isolated areas can be excluded. First, we define the concept of an isolated area:
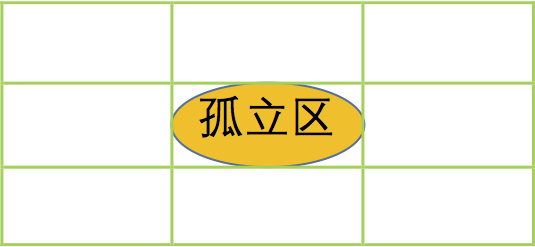
Isolated Area: Starting from a connected component, find its horizontal bounding box. Expand this rectangle symmetrically from its center to 9 times its original area (the length and width become 3 times the original, as shown in the figure). If the expanded area does not contain any other connected components, the original connected component is called an isolated area.
In most cases, isolated area exclusion is a very simple and effective denoising method, as many noise points are isolated. However, isolated area exclusion carries certain risks. If an image contains only one character, forming a single connected component, that component will be isolated and thus excluded. Therefore, additional restrictions must be placed on isolated areas. One optional extra restriction is that the ratio of the area of the connected component to its bounding box must be greater than 0.75 (this value is derived from the ratio of the area of a circle to its circumscribed square, \pi/4).
When reposting, please include the original address: https://kexue.fm/archives/3802
For more detailed reposting matters, please refer to: Scientific Space FAQ